There are five options for charts that can be set from the web.config file to set the preferences for chart display for your organisation. If you were to add the default (for no change) to web.config they would look like this:
<appSettings>
...
<add key="ChartBgGradientLevel" value="3" />
<add key="ChartUseHatching" value="false" />
<add key="ChartUseAntiTargetbackgroundColor" value="false" />
<add key="ChartTargetbackgroundColor" value="rgba(64, 192, 0, 0.25)" />
<add key="ChartAntiTargetbackgroundColor" value="rgba(128, 0, 0, 0.50)" />
...
</appSettings>
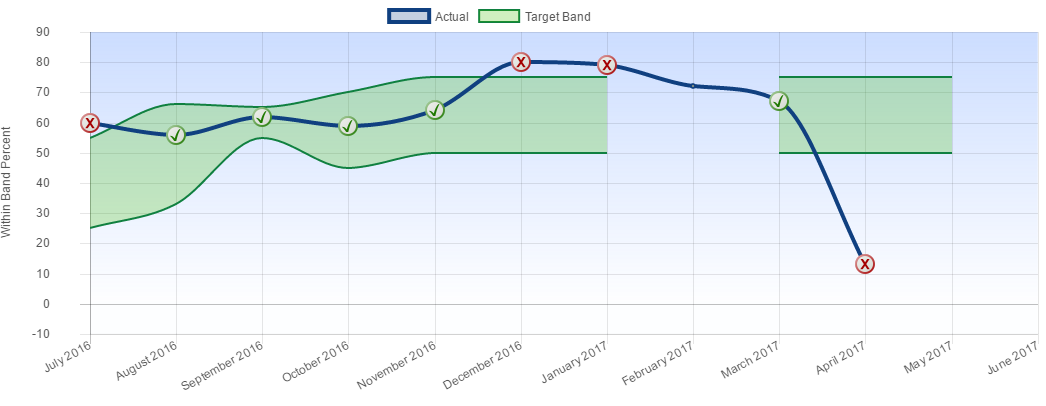
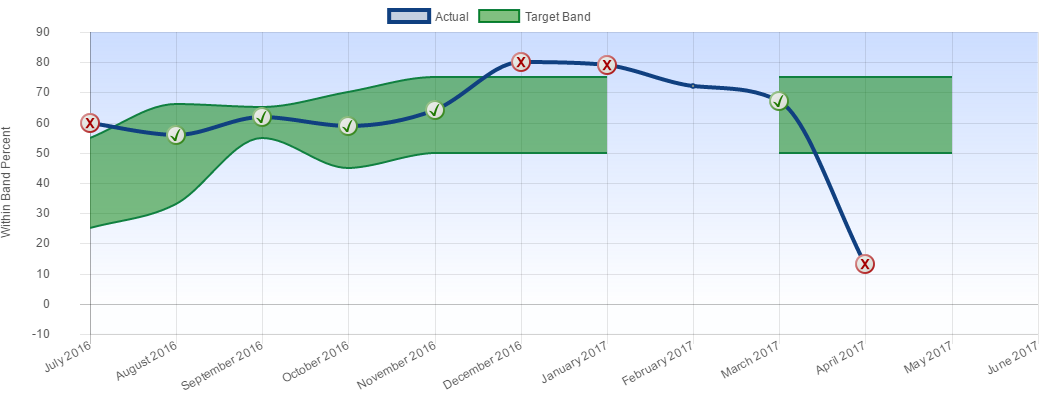
The following chart uses the default settings. This chart with made up data for shows a 'band' chart, with some actual data missing, and some target data missing. Note that where the target data is missing it is unable to show the status for that period (February 2017), since there is no target with which to compare. The targets are added for May 2017, but there is no actual as yet.
With just these 4 settings we can make some significant changes. For example, if you didn't like the gradient in the background, you preferred hatching, rather than shading, and wanted to show the non-target area as well you could change the settings to:
<appSettings>
...
<add key="ChartBgGradientLevel" value="0" />
<add key="ChartUseHatching" value="true" />
<add key="ChartUseAntiTargetbackgroundColor" value="true" />
<add key="ChartTargetbackgroundColor" value="rgba(0, 128, 0, 0.50)" />
<add key="ChartAntiTargetbackgroundColor" value="rgba(128, 0, 0, 0.50)" />
...
</appSettings>
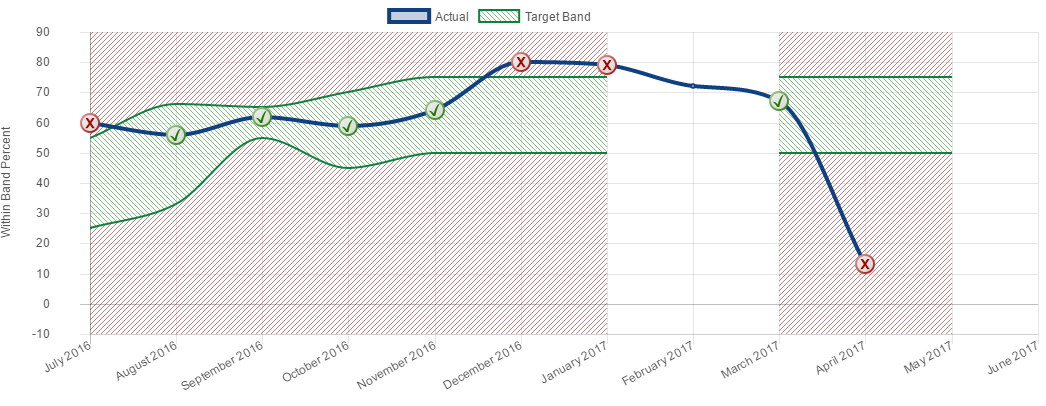
Here, we show the target area in a a hashed (stripped) green, from left to right, and the non-target, or anti target area in a red hash, from right to left.
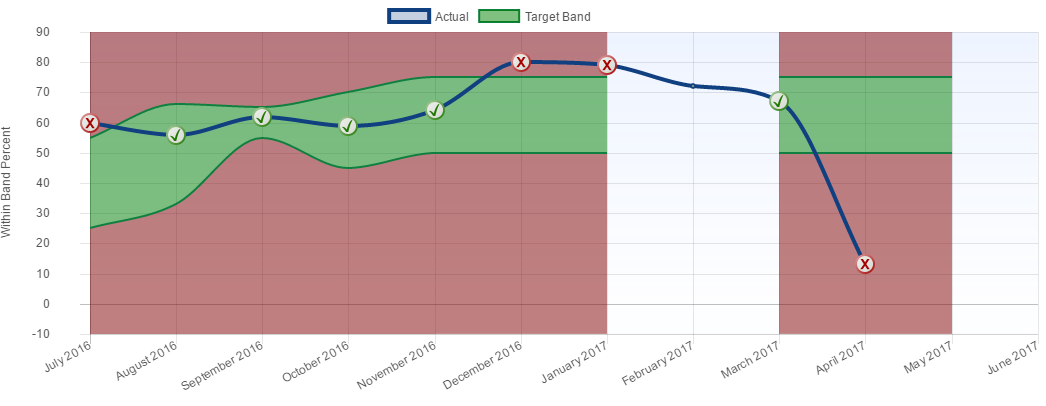
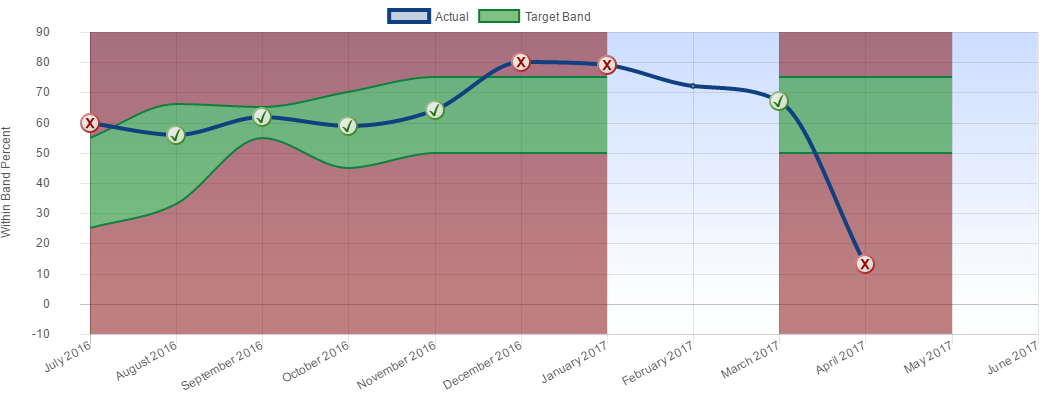
If we use this <add key="ChartUseHatching" value="false" /> and add a very mild gradient in the background <add key="ChartBgGradientLevel" value="1" />,then the target and anti-target areas become a solid colour, though, because they are not completely opaque we can see the grid behind them.
While very faint, there is a background gradient, to give the charts a tiny bit of polish. To add more set: <add key="ChartBgGradientLevel" value="3" />
If you only want to see the target area and not the anti-target area, then set <add key="ChartUseAntiTargetbackgroundColor" value="false" /> or <add key="ChartAntiTargetbackgroundColor" value="rgba(128, 128, 128, 0.00)" />. (The important part is the 0.00, which sets the 'a' the alpha channel or the opacity of the colour to zero, allowing 100% of background to be seen.)
.
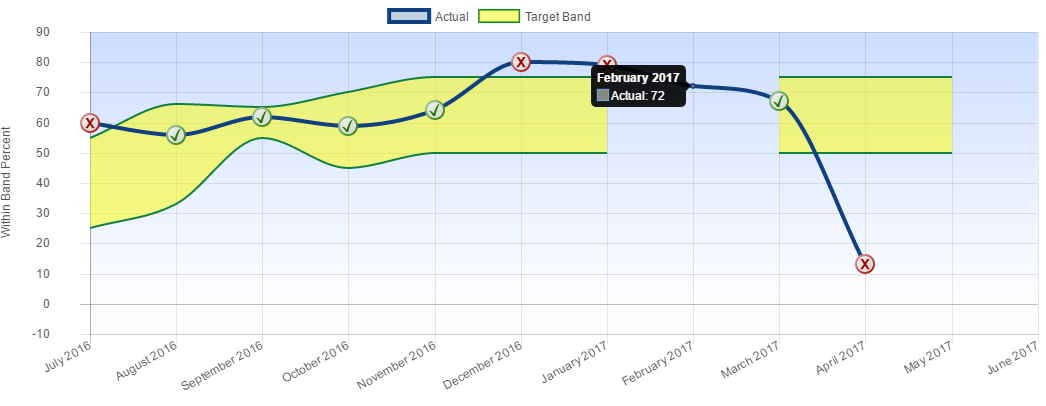
If you wanted to change the target colour to something brighter, perhaps a different colour, you can change the RGBA values (Reg, Green, Blue, Alpha) to match the colour you want (RGB from 0 to 255, and A 0 to 1). We recommend that you leave the alpha (opacity) at some value well less than 1, so the grid is visible in the target area. In this example we have a yellow target area. <add key="ChartTargetbackgroundColor" value="rgba(255, 255, 0, 0.50)" /> Note the tool tip here shows that we have actual data, but no target data for February.
These are the only options to change the charts. If requested we may open more options up, so the format of the charts can be changed, at a corporate or at an individual level.